
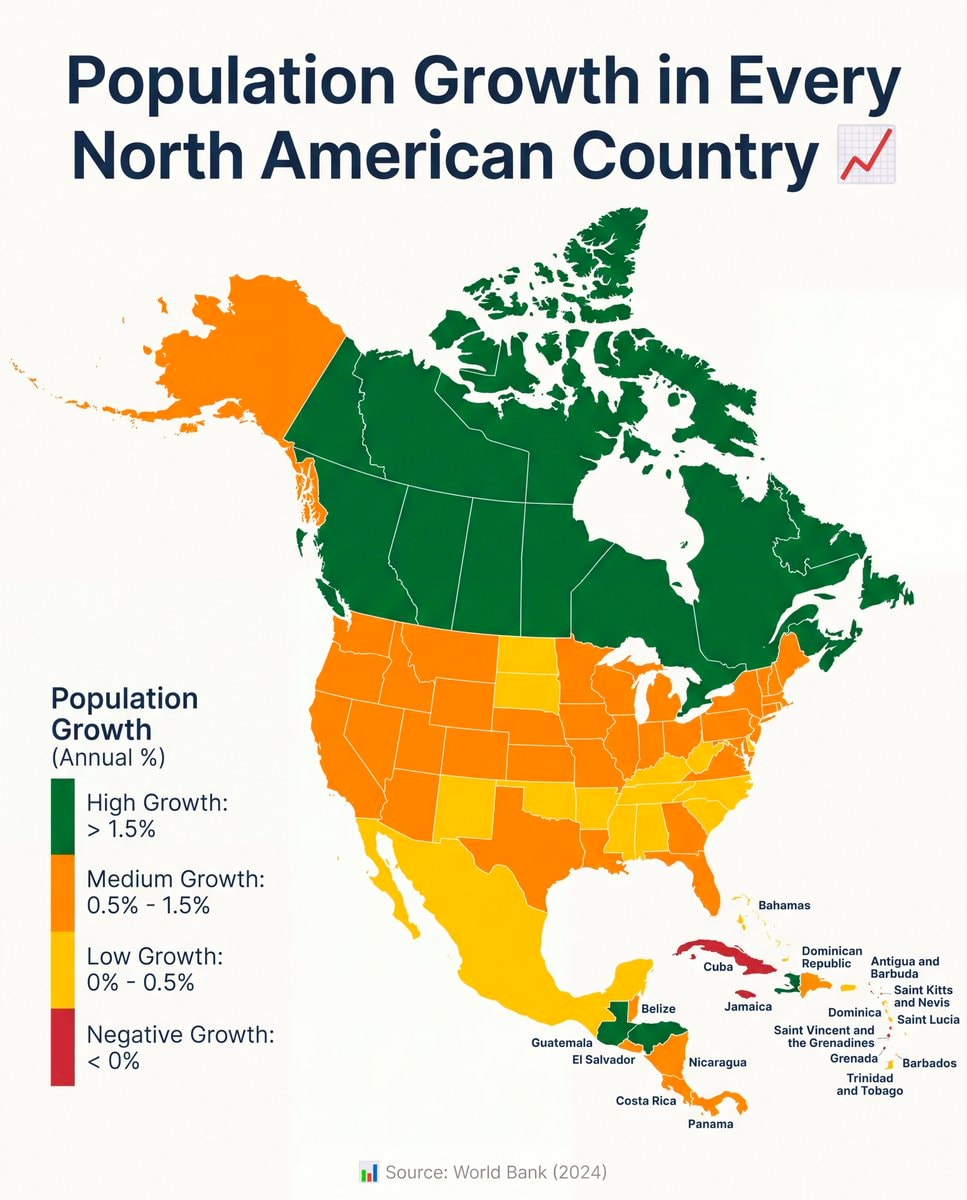
@savageupdatesActually this board breaks down population growth across every North American nation
Originalbeitrag ansehen@savageupdatesActually this board breaks down population growth across every North American nation
Originalbeitrag ansehenFoto von @savageupdates· Oct 29, 2026· World Bank
The image is a map of North America showing population growth by country. Countries are color-coded to indicate high, medium, low, or negative growth. The map is presented in an infographic style with a clean, data-driven aesthetic. A red line graph icon is visible next to the title. The source is listed as "Source: World Bank (2024)".
@savageupdatesActually this board breaks down population growth across every North American nation
Originalbeitrag ansehenFoto von @savageupdates· Oct 29, 2026· World Bank
The image is a map of North America showing population growth by country. Countries are color-coded to indicate high, medium, low, or negative growth. The map is presented in an infographic style with a clean, data-driven aesthetic. A red line graph icon is visible next to the title. The source is listed as "Source: World Bank (2024)".
Noch keine Kommentare. Sei der Erste!

Noch keine Kommentare. Sei der Erste!